
One of the most important metrics to look at when you are testing an application on a linux server is load avg. If you are used to testing applications on Windows, ensure that you look at this metric for Linux machines.
Getting the data
Load avg can be collected a number of ways.
uptime

top
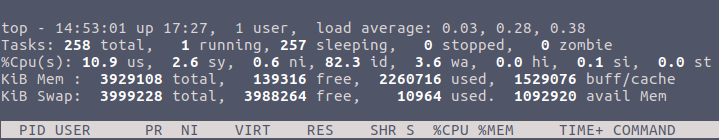
cat /proc/loadavg

What is LoadAvg
From Linux man pages:
/proc/loadavg
The first three fields in this file are load average figures
giving the number of jobs in the run queue (state R) or
waiting for disk I/O (state D) averaged over 1, 5, and 15
minutes. They are the same as the load average numbers given
by uptime(1) and other programs. The fourth field consists of
two numbers separated by a slash (/). The first of these is
the number of currently runnable kernel scheduling entities
(processes, threads). The value after the slash is the number
of kernel scheduling entities that currently exist on the
system. The fifth field is the PID of the process that was
most recently created on the system.
Very simply put, loadavg is the average amount of processes in a “Running” or “Waiting” state. It is shown as 3 figures. 1, 5 and 10 minute averages.
So on a single core machine, a loadavg of > 1 means that a process somewhere is waiting for cpu time and can’t do it’s work because the system is overloaded*. On a 24 core machine, a loadavg of < 24 is perfectly OK.
Note: *You can have very high loadavg and low cpu because some processes may be waiting on IO/Disk. e.g. if your processes are writing to a slow disk/NAS
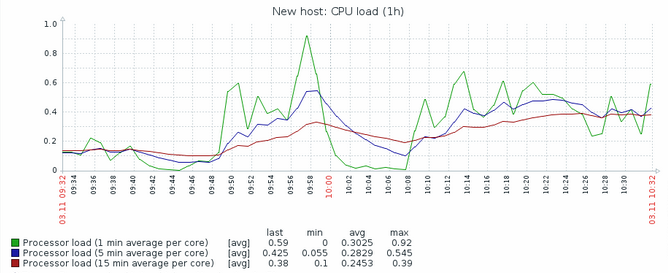
Most monitoring tools for Linux collect loadavg and it is good to use all 3 metrics in a graph.
Author: Aodan